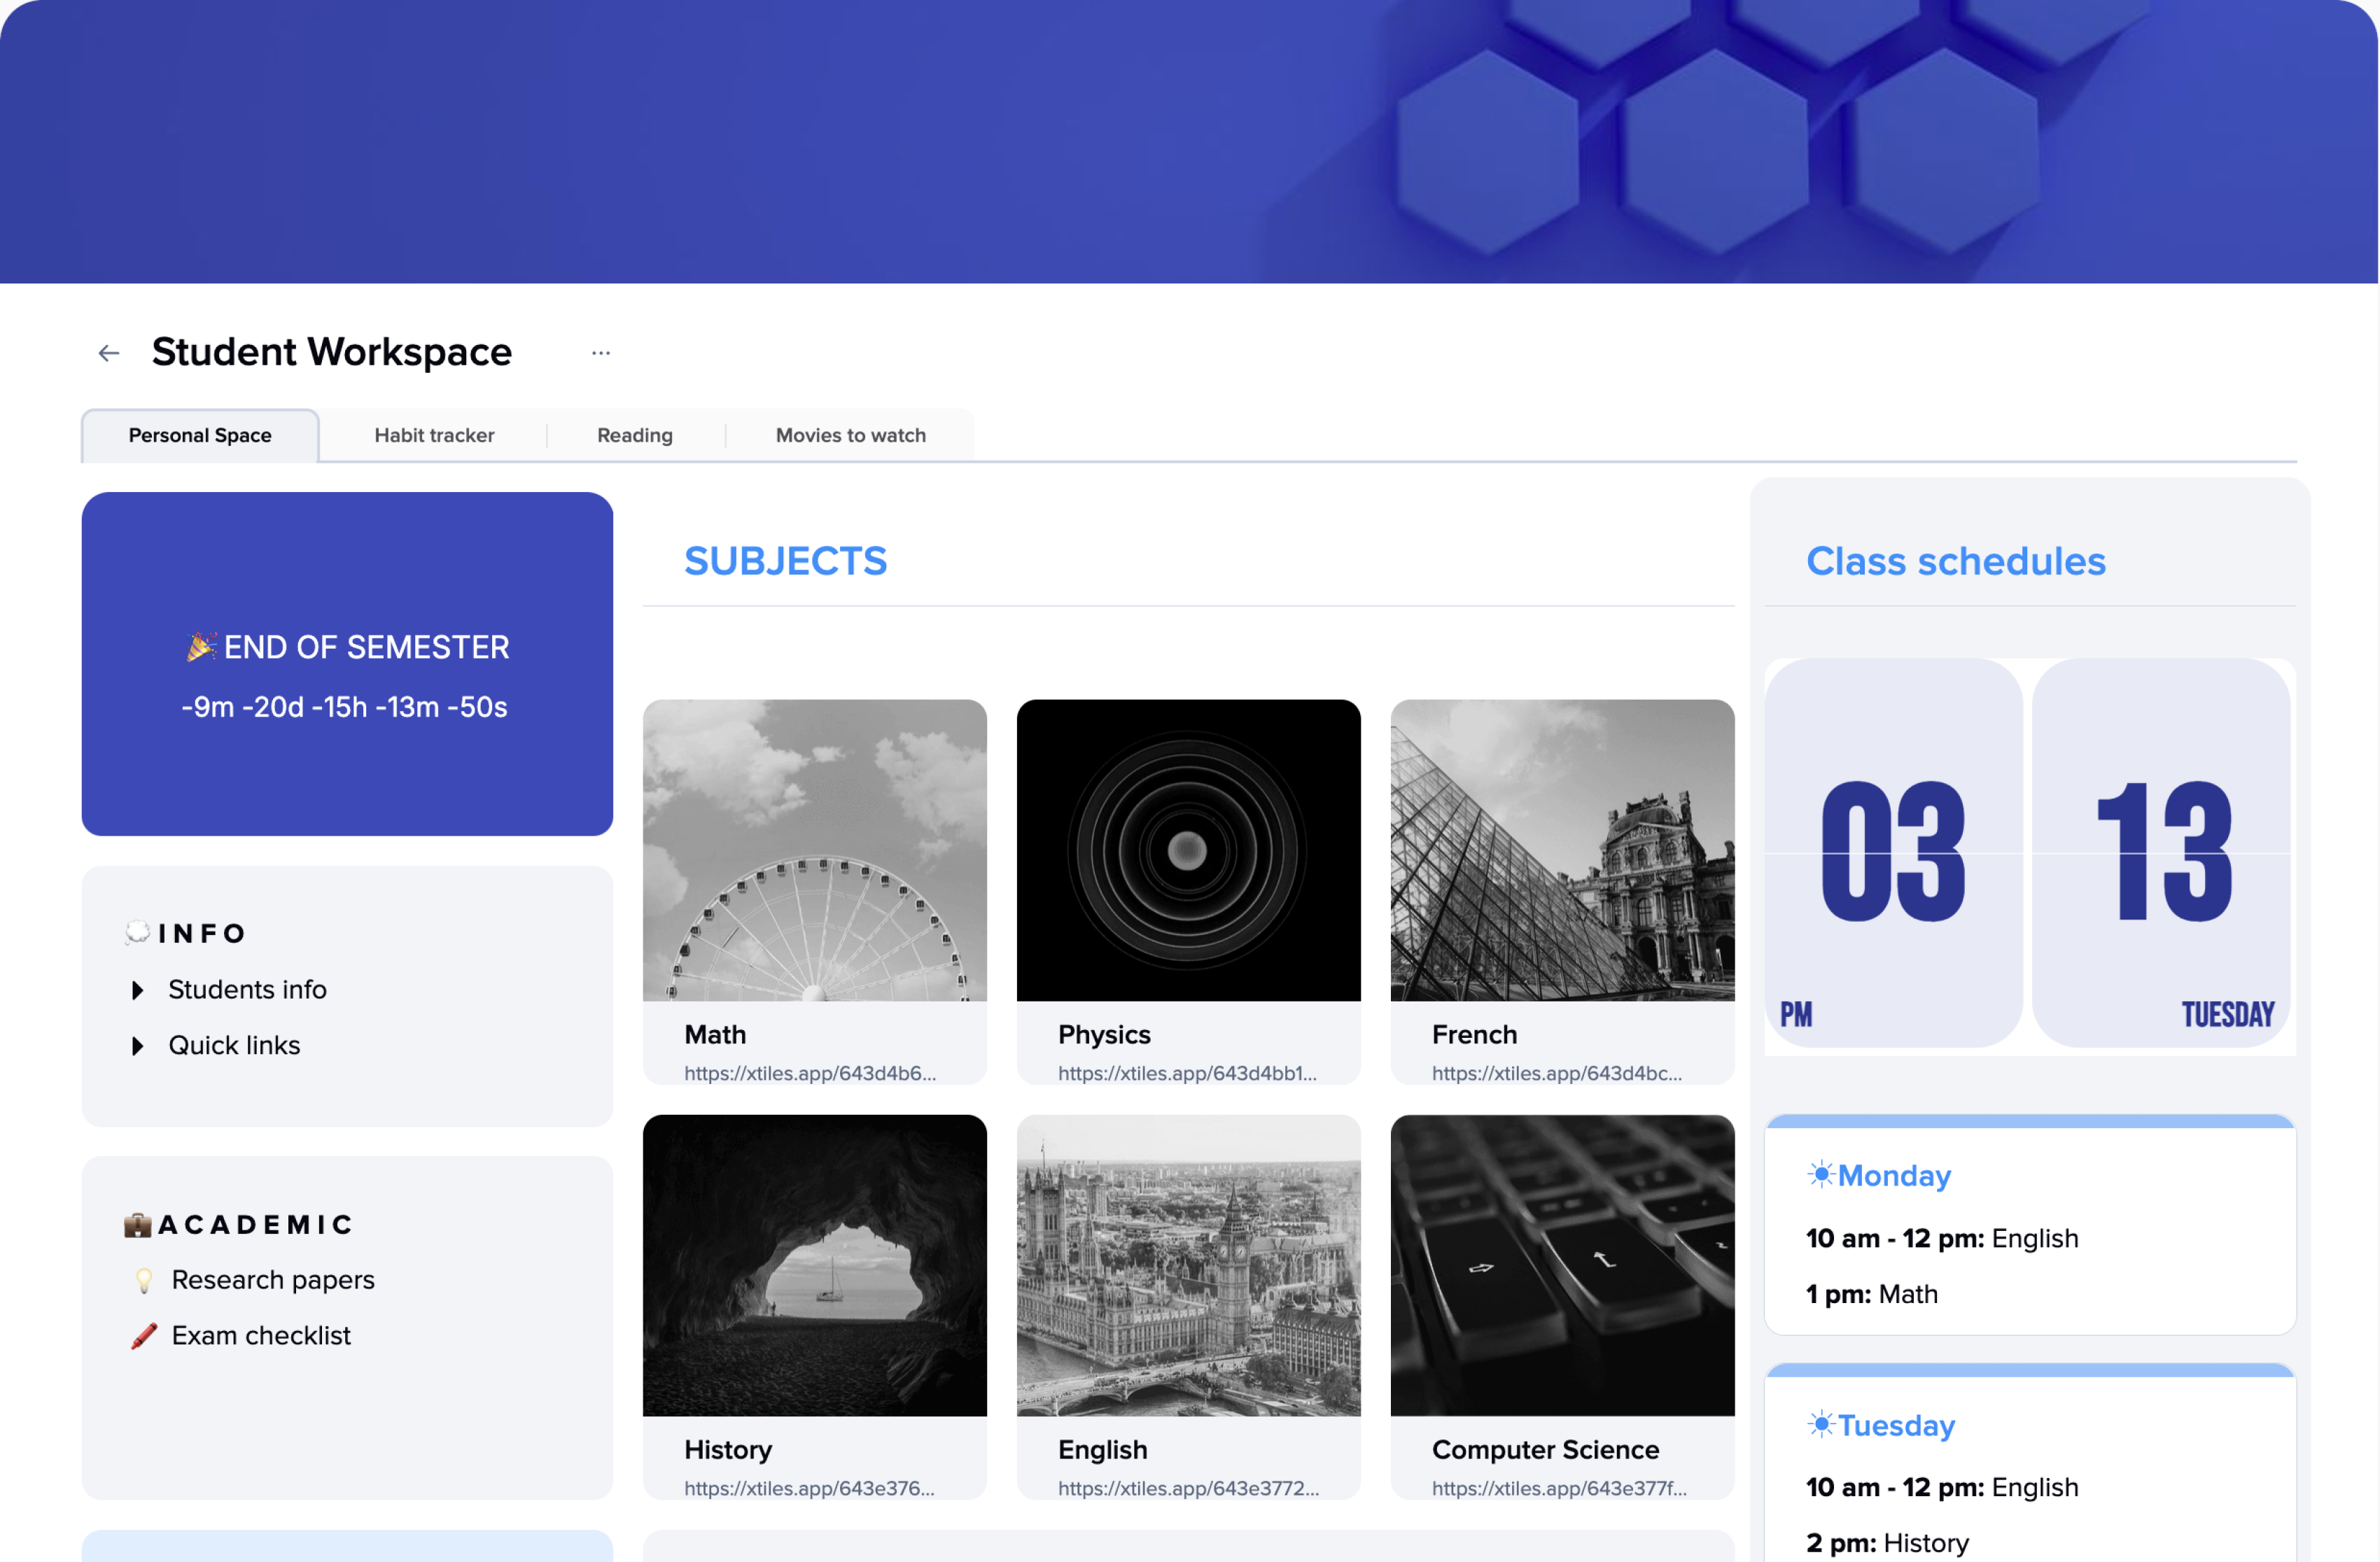
How to use a KWL Chart?
To start using a KWL Chart, you need to create a table with three columns – K, W, and L. We have already done it for you in our template. Now, let’s fill each column with the relevant information so that you will have a representative and helpful document and not useless gibberish at the end.
Our pre-filled example of the KWL Chart will help you grasp the concept if this is something you have never used before.
Column “K” – Know
In this column, you need to write down everything you already know about the subject. However, if the topic is something entirely new to you, don’t worry. You probably have some associations. Note them because they are an important part of how you understand the topic.
Sometimes a teacher needs to push their students so they can come up with some ideas or thoughts on the topic. That’s why you may need to prepare some questions beforehand.
This column is supposed to help a teacher and students to understand what misconceptions they might have going into some topic. That’s why KWL Charts will be useful when you only start working on something new. Then they will help you check your intermediate results and track your progress. And, in the end, they will help you fill gaps if there are some.
This stage doesn’t require corrections if you’re a teacher. It’s more about showing the real picture, so you can plan your learning accordingly to the real issues and needs. However, if you prefer to make clear something with your class before you start, you’re free to do so.
Column “W” – Want to Know
When the first column is filled, it will be easier to identify what exactly you want to learn or what your students want/need to learn during the lesson or course.
If you split your students into groups, you will get more answers which will be helpful for the whole class. Ask students to note others’ answers if they feel that they resonate with their goals.
When you use KWL Chart for personal needs, be honest with yourself filling it in. It’s OK not to know something, and that’s OK to be interested in something that might seem weird.
Sometimes, simple questions like “Who?”, “What?”, “When?”, “Why?”, “How?” are enough to help understand what exactly needs to be learned or polished. Also, they will be enough to start a discussion in a class that may lead to more meaningful conversations and questions.
Filling this column, students help their teacher create a better lesson plan that will suit their needs.
Column “L” – Learned
The last column will conclude what you learned during a lesson. You may fill it in at the end or work on it throughout the lesson.
What kind of information should you put in this column? That’s the exact place to answer your questions from the second column. Also, that’s the exact place to correct your opinions and ideas from the first column in case there was some misconception. Everything you find amusing or interesting should end up in this column too.
This column helps you review what you have learned. And later, it will be useful for retrospecting a topic you need to go over again. If you’re a teacher, it will help you check what was unclear for your students.
Optional columns
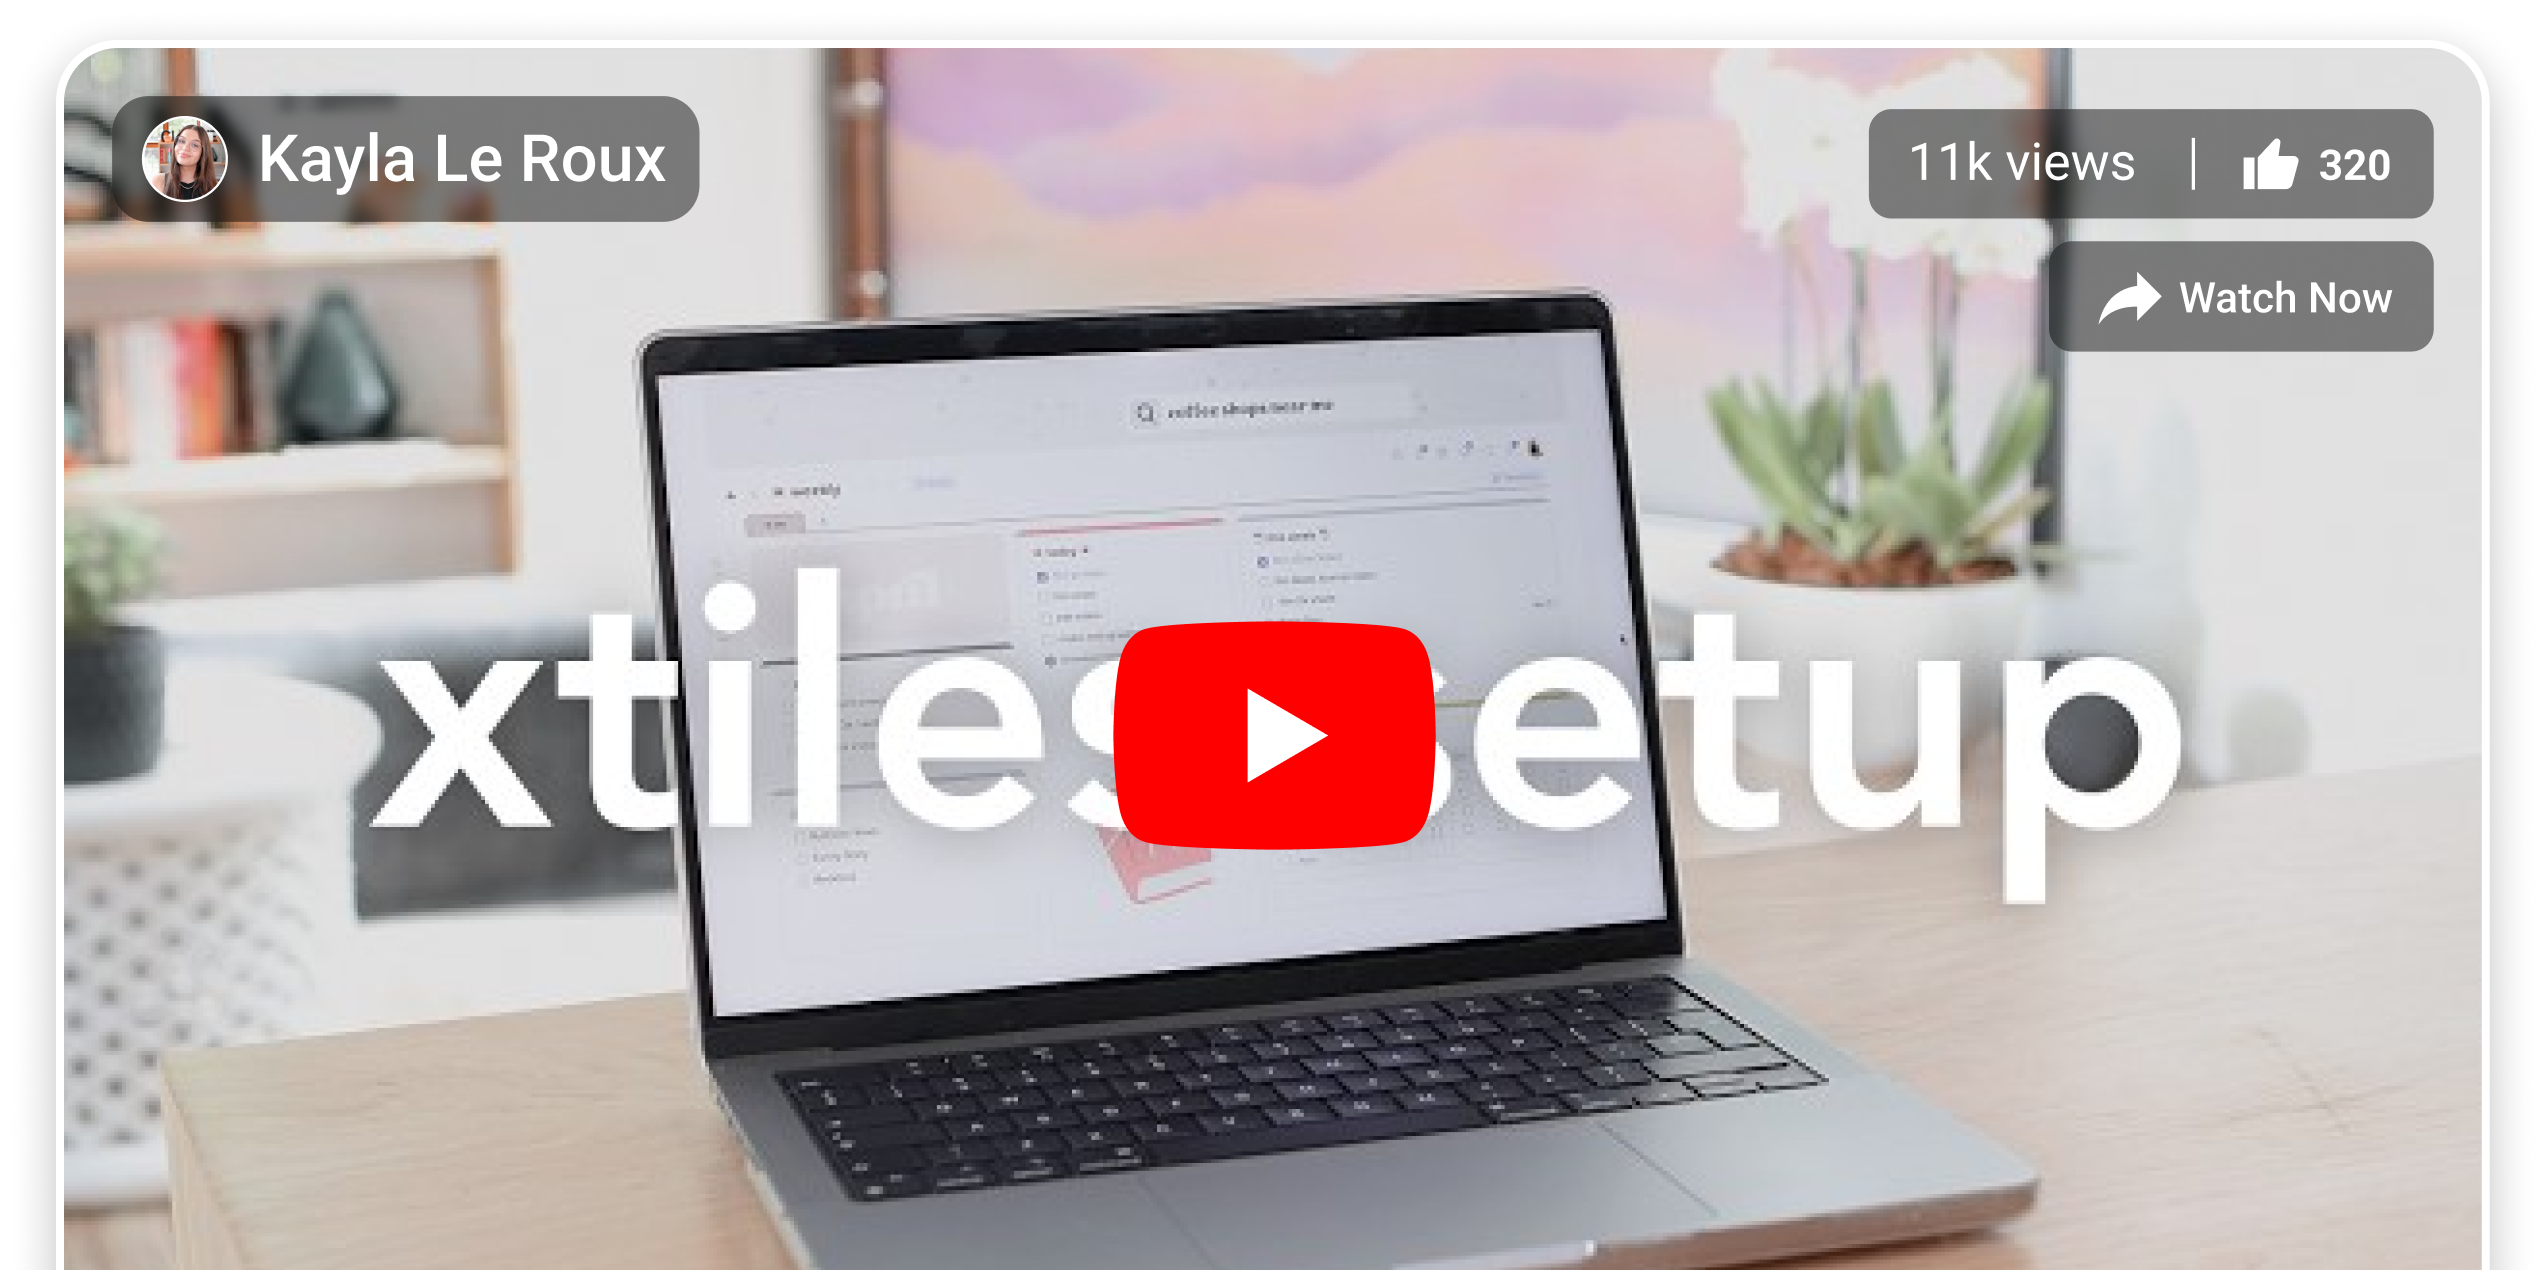
Even though the traditional structure of the KWL Chart is well-known and pre-defined, no one can stop you from using it as you wish. You’re free to divide your columns into different sections, or you may add more columns if you want. The xTiles KWL Chart template is highly flexible and allows you to organize your learning materials the way you prefer.
What columns may make a KWL Chart even more helpful? For example, after you review your newly gained knowledge, you may add a column “Still needs to be learned” if there’s something you struggle to memorize.
Another helpful column or little section may be devoted to resources you used to find the information. You also may add a place for additional questions that arose after you dived deep into the new topic.